How Fair Value Is Calculated — 4 Methods and 3 Scenarios
Last updated: 2026-08-29
jini's fair value is never a single number — it's always a range. We apply 4 different methods, each across 3 scenarios (bear, base, bull), then take the median of the valid results to ground our verdict.
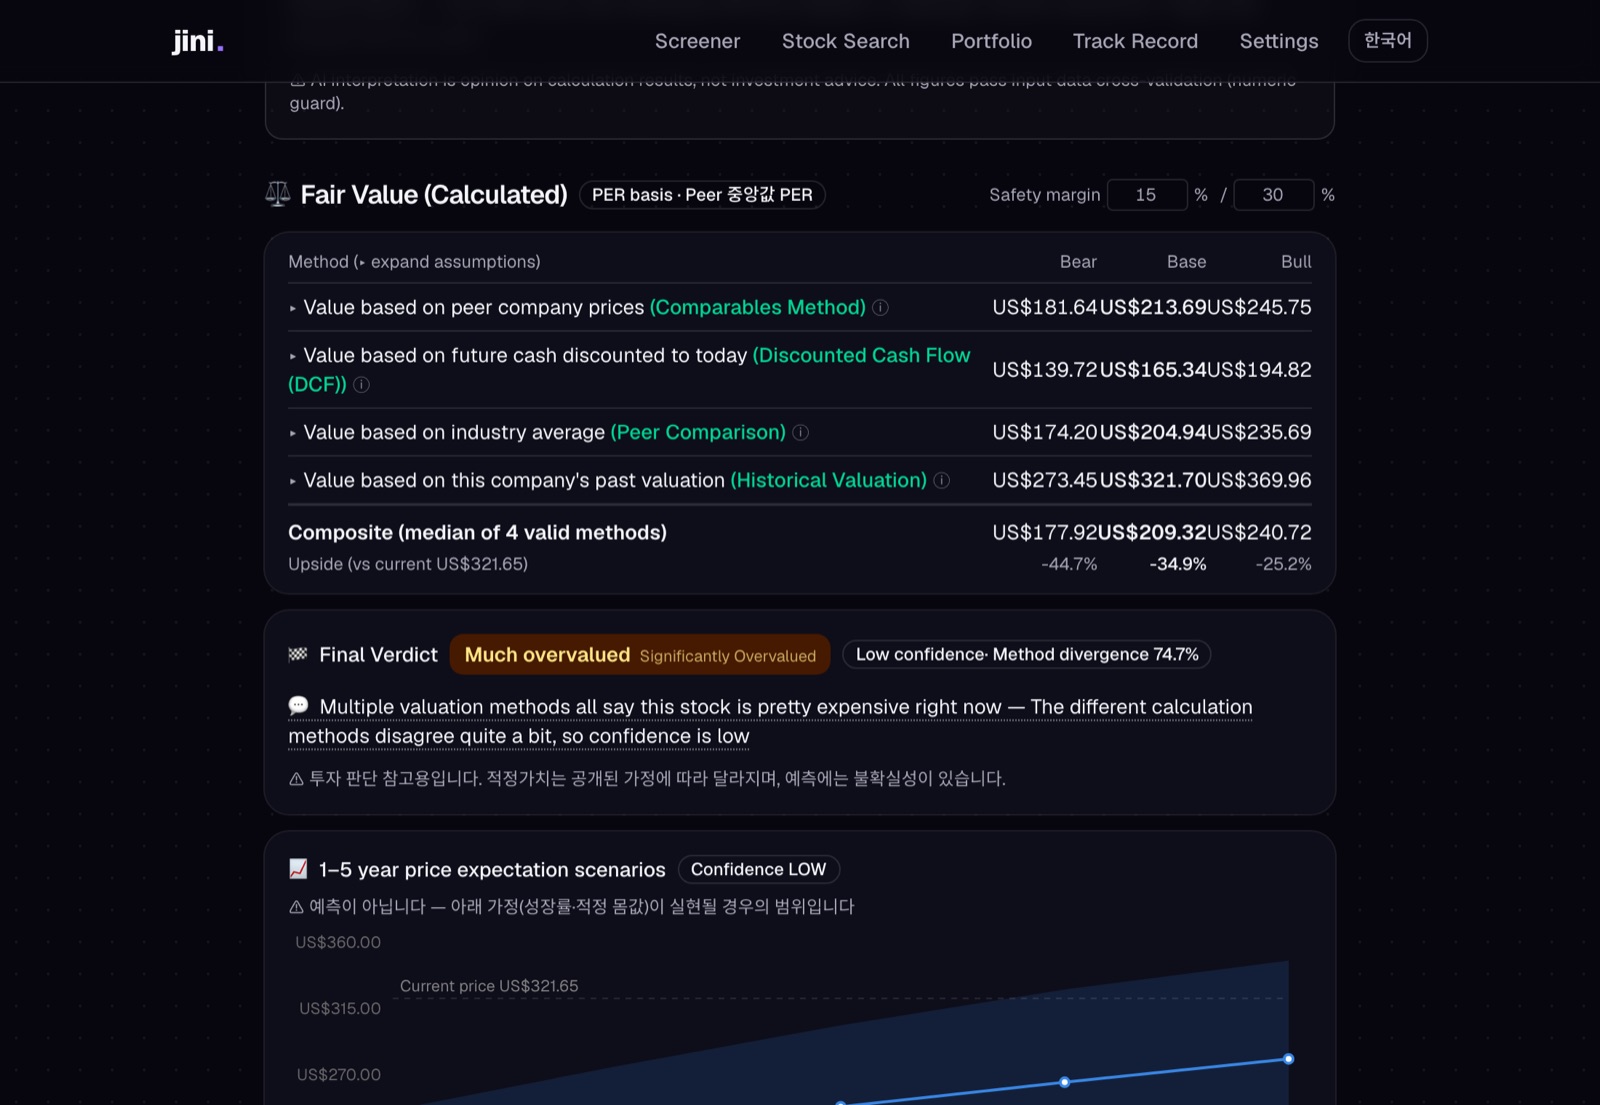 Fair value table (4 methods × scenarios), final verdict, and margin-of-safety inputs (top right)
Why four methods, not one
The easiest way to fool yourself in investing is to trust a single metric. Low P/E? It must be cheap — a thought that leads straight into value traps. But:
- A loss-making company's P/E is meaningless — there's no earnings to measure
- A fast-growing company should have a high P/E — the market prices in future growth
- Using only historical multiples misses sea changes — the industry may have fundamentally transformed since then
That's why jini looks at the earnings themselves (absolute dollar earnings), what peers with similar economics trade at, what the firm's own history commands, and its intrinsic cash-generation power. If one method is broken, the others can spot it.
The four methods
① Multiples — Current Earnings × Fair Multiple = Price
The simplest and most intuitive: "What does an earnings dollar go for in this industry?"
- Fair multiple comes from peer median (or past 3-year average if peers are sparse)
- For loss-making companies: use revenue multiples (P/S) instead
- The basis is always disclosed — click ▸ and you'll see "Why we chose this multiple"
Strength: Most directly tied to current market price
Limit: Doesn't explicitly account for growth, profitability quality, or cash reality
② DCF — Discounted Cash Flows
5-year cash flow forecast + terminal value (perpetual growth after year 5) = Value
This method asks: "What is all future cash this company will generate worth in today's dollars?"
- Take annual free cash flow per share over 5 years
- Discount it at ~10% (the long-term market return investors demand on stocks)
- After year 5, assume steady perpetual growth (2.5% default, the rate of nominal GDP)
- Scenarios adjust growth: base uses consensus, bear/bull use base ±50% (clamped to −10% to +25%)
Strength: Most direct look at cash generation and long-term growth power
Limit: Highly sensitive to growth assumptions — a 2% change in growth assumptions can swing the value 30%
③ Peer Multiples
Peer median multiple × Current earnings = Adjusted price
Start with what similar companies trade at, then adjust for this firm's unique strengths and weaknesses, within a ±15% band.
- Upside adjustments: Higher growth (+), stronger competitive moat (+), higher margins (+)
- Downside adjustments: Financial risk (−)
- Size of adjustment scales with the score (if growth score is 100, apply +10%; if 0, apply −10%)
Strength: Captures company-specific edge and risk that pure peer average would miss
Limit: Scoring is transparent but still contains human judgment
④ Historical Multiples
Company's 3-year average multiple × Current earnings = Historical fair price
What has this company historically traded at? Take the median P/E or P/S from the past 3 years and apply it to today's earnings.
- E.g., if Samsung's P/E averaged 10x over the past 3 years, apply 10x to today's EPS
- Scenarios: ±15% around the historical average to reflect historical volatility
Strength: Shows the firm's "normal" valuation level
Limit: Misses structural industry shifts or a company's transition from one business model to another
The three scenarios
Each method gets run three times:
Bear — Downside Case
- Consensus growth fails to materialize; earnings disappoint
- Reflects the plausible worst case (not catastrophic, just realistic downside)
- For multiples: −15% from the baseline
Base — Market Consensus
- Analyst consensus growth rate comes true
- Current earnings hold and grow as expected
- For multiples: the central/average multiple
Bull — Upside Case
- Company beats consensus; new products land better than expected
- Or the business fundamentally improves faster than anticipated
- For multiples: +15% from the baseline
Why a range, not a target
Here's what the 12 calculations might look like in practice:
Base scenario fair value by method:
  Multiples:    $25,000
  DCF:          $22,000
  Peer:         $26,500
  Historical:   $23,500

Median: ~$24,000
If the stock trades at $20,000, that's roughly 16% below the median base-case value. But you also need to know:
- Is it still cheap in the bear scenario? (downside protection check)
- How much upside if the bull case plays out? (expected return)
- Do all four methods agree? (confidence in the judgment)
That's why you get a range, not a point target.
Every assumption is visible
Open up any fair value calculation and every assumption sits right there:
- Multiples: Where the multiple came from (peer median vs. historical average) and the exact number
- DCF: Discount rate (10%), terminal growth (2.5%), forecast period (5 years)
- Peer & Historical: The score for each adjustment factor and how much it was actually adjusted
Click ▸ and verify the calculation. This is what jini means by "decision material with every assumption exposed."
When a method doesn't apply
Sometimes one calculation just doesn't work:
- DCF: No free cash flow data, or the company is burning cash
- Multiples: A loss-making company with no relevant peer multiples
- Peer: An industry too small or too different to find good comparisons
When that happens, the method is marked "not applicable," and the verdict is based on the valid methods only. You need at least 2 working methods to issue a verdict — jini's way of avoiding phantom precision.
Next: Verdict and Confidence
The fair value range becomes raw material for the verdict. Compare it to the stock price, factor in quality and financial health, and you get a final judgment on valuation. And if you want to see what 1–5 year returns look like under base and bull scenarios, those are also laid out with their growth assumptions for each year.