Turning the numbers into a strategy
Last updated: 2026-08-29
A stock page displays many numbers. This guide walks you through the order to read them, and which signals deserve trust.
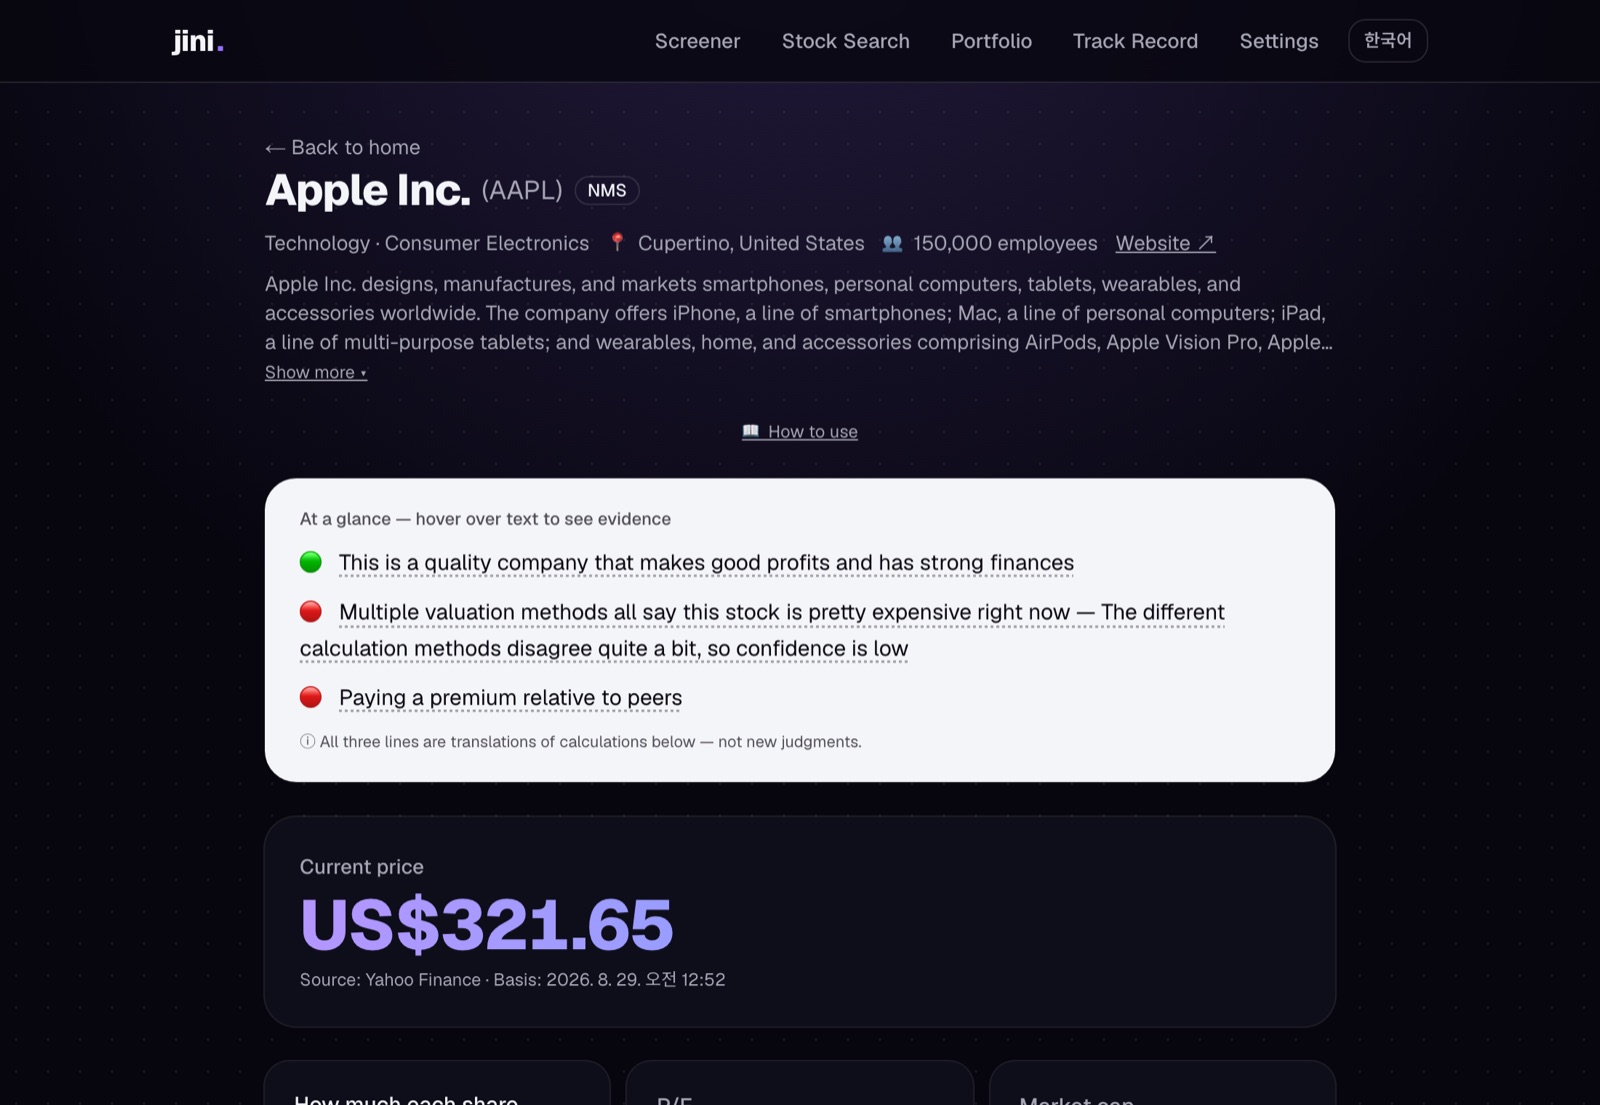 Top of a stock page — the 3-line summary and current price
Reading order: top to bottom, filtered
Step 1: At a glance — the three traffic lights
At the very top, three lines:
- 🟢 / 🟡 / 🔴 Business Quality — is it profitable and well-run?
- 🟢 / 🟡 / 🔴 Price Now — is it cheap?
- 🟢 / 🟡 / 🔴 Confidence — do the calculators agree?
The three-line summary is a "translation" of everything below. It is not a separate verdict. All green is best, but pay serious attention only when price is green (cheap) AND business quality is green. The other combinations deserve less weight.
Step 2: Business quality — 8 dimension scores
The composite score answers "how good is this business?" Read the 8 dimensions top to bottom:
- Growth — are revenue and earnings expanding fast?
- Profitability — does it manage costs well and earn profit?
- Earnings Quality — does cash actually flow in? Any accounting red flags?
- Cash Flow — can it fund itself and pay shareholders from what it generates?
- Financial Health — is debt at a dangerous level?
- Valuation — is the current price cheap vs. history and peers?
- Market Expectations — is the growth the market expects realistic?
- Risk — how volatile is the stock?
Trust these scores, but one or two weak dimensions don't kill the story. A mature utility with low growth but fortress-like finances is still a sound investment. However, if "Earnings Quality" is low, pause. It signals that cash is not actually flowing in.
Click ▸ on any dimension to see the underlying metrics. If you want to dig deeper, that is where the individual numbers live.
Step 3: Verdict — 5 levels + confidence
Five levels: Strongly Undervalued / Undervalued / Fairly Valued / Overvalued / Significantly Overvalued. The most important part is confidence.
- HIGH confidence: All 4 valuation methods nearly agree → trust the verdict
- MEDIUM confidence: Mostly aligned, but one or two disagree → take it as guidance, not gospel
- LOW confidence: Methods diverge sharply → treat the verdict as weak. This does not mean "bad company"; it means "current data does not give a clear answer"
Even if the verdict says undervalued, low confidence is a red flag. Especially if confidence is LOW and the AI analysis diagnoses "Type D (Value Trap) or Type E (Cyclical Trap) with high conviction, the system automatically downgrades — it is a warning that "this looks cheap but may be a trap."
Step 4: Market expectations (implied growth) — reality check
This reverses the math: what growth rate does the current price require to be fair?
- Gap is negative (market requires lower growth than forecasts suggest): the market holds low expectations → room for upside surprise is limited
- Gap is positive (market requires higher growth than forecasts): optimistic assumptions are already baked into price → risk of disappointment
The larger the positive gap, the more the stock is betting on a bull case. An undervalued verdict with a large positive gap is still a bet on optimism. Keep one foot back.
Red flags to skip, even with an undervalued verdict
RED FLAG 1: LOW confidence + Type D/E downgrade
Undervalued verdict + LOW confidence + AI diagnoses "Value Trap / Cyclical Trap" with high conviction → skip immediately
The system has automatically downgraded this for you.
RED FLAG 2: Earnings Quality score much lower than other dimensions
Among the 8 dimensions, if Earnings Quality alone is notably weak, the company may depend on accounting sleight of hand or non-cash gains (FX, asset revaluations). High composite score but weak earnings quality? Suspicious. Take it down a notch.
RED FLAG 3: Market expectations (positive gap) > 20%
"This stock requires 20%+ annual growth to be justified now." If 5-year historical growth is 5% but the market expects 20%, something major has to change. Cross-check against news and industry trends — is that shift actually happening?
RED FLAG 4: AI says "moat is weak" + low scores on growth and profitability
If the AI judges the competitive moat weak while growth and profitability scores are low, the company sits in an open market where anyone can compete. The reason it is cheap is clear: no differentiation.
RED FLAG 5: Changing the "safety margin" slider flips the verdict
Try the safety margin slider next to fair value. If raising it from 15% to 30% changes the verdict from Undervalued to Fairly Valued, the current price is undervalued by a razor-thin margin. One bad quarter could send it below fair value. This is a candidate to wait for a deeper discount.
Summary: how to read
- The three traffic lights: Is business quality good AND price cheap?
- 8 dimension scores: Which area is weak? (Watch especially Earnings Quality)
- Confidence: If not HIGH, hold the verdict lightly
- Market expectations gap: Is the expected growth realistic?
- AI Type D/E diagnosis: If downgraded, skip it
- Gut check vs. news: Do the calculations line up with news and industry trends you know?
Scores and verdicts are a starting point, not an endpoint. If confidence is low or even one red flag appears, step back. Better opportunities always come.
Trust the numbers, but combine signals; no single one is decisive. Remember too that even the system's verdict can be wrong. At the bottom of the stock page, the "8 Final Questions" section grounds the logic in plain language. Use it to double-check that you and the model agree. If doubt lingers, the tracking page shows how past verdicts of the same type actually performed — real accountability.